
")
")
")
A SIMPLE METHOD TO MEASURE THE SOUND VELOCITY / RADIATION RATIO IN SOUNDBOARD WOOD.
Chris Van Heddegem, CMB Puurs 2012-2013
Introduction
Building musical instruments always starts with the selection of the most suitable materials.
The most important parameter of soundboards material is the radiation ratio, which is determined by the stiffness and the density of the material and which is calculated by dividing the sound velocity by the density. This ratio should be as high as possible (preferably higher than 15 along the grain) to give maximum sound output.
Traditionally soundboards material is tested manually by bending to get an idea of the stiffness and by estimating the weight.
However with some simple tools that are now commonly available to us, it is also possible to calculate the radiation ratio based on a few simple measurements.
The density ρ in kg/m3.
This is easily calculated by dividing the weight of a rectangular cut-off of the soundboard by the volume.
The sound velocity V in m/s.
The sound velocity can be calculated from the longitudinal resonance frequency of the material, or by measurement of the transit time of an ultrasonic wave sent through the material. The Lucchi meter is based on the latter principle1. For many musical instrument builders the price of the Lucchi meter (approx. 2,500 EUR) is however an obstacle.
The method described here is based on the first principle and the use of some inexpensive tools (usually one will already have a computer available).
This method was brought to the attention of some violinmakers on maestronet.com by Don Noon, a mechanical engineer and amateur instrument builder. Measurements along the grain on blanks for violin tops have been extensively discussed on the maestronet.net forum and comparative measurements with the Lucchi meter were performed by Anders Buen, who determined a deviation of less than 2%. Incidentally even the Lucchi meter does not always show the same result.
It should be noted that the measurements were performed on billets for violin tops and that in this case the fundamental and its harmonic frequencies appear clearly on the FFT graph. The situation with blanks for guitar sound boards is a little be different, the fundamental frequency (highest peak in the FFT graph) is still clearly recognizable, but overtones are masked by vibration modes, other than the longitudinal resonance.
SOME THEORY
In a solid, the velocity of longitudinal sound waves is controlled by two basic materials properties: the elastic constant and the density. The longitudinal sound velocity is calculated by the following formula: ![]()
where V (m/s) is the sound velocity in the material, L (m) the length of the object and ƒn (Hz) the frequency. n = 1 for the fundamental and ƒ1 is taken from the FFT graph. Furthermore: ![]()
where E is the elastic modulus (N/m2), and ρ the density (kg/m3).
On its own, the sound velocity gives already an indication of the quality of the wood. A higher elastic modulus (stiffness), and a lower density result in a higher sound velocity, and these are exactly the criteria for judging the quality of soundboard materials.
Radiation ratio ![]()
Is the sound velocity divided by the density.
THE EQUIPMENT
- Microphone cap
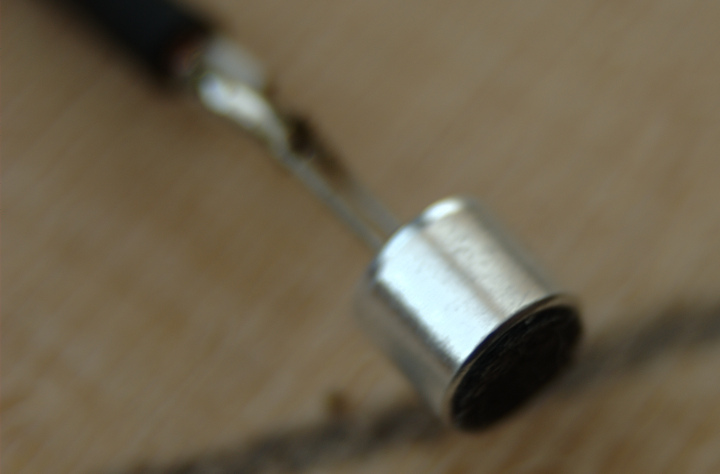 preferably of the electret type. We used the microphone cap KPCM-G60H50P-44dB-1185, with a diameter of 6 mm, frequency range 20-16000Hz. Available from Conrad @ 0.38 EUR.
 - Microphone preamplifier
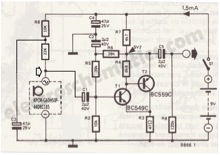 A pre-amplifier is required to connect the electret microphone cap to the computer. Plenty of microphone preamplifier circuits can be found on the internet. This circuit has been adapted for the microphone cap mentioned above. The circuit fits in a standard box, along with a 9V battery.
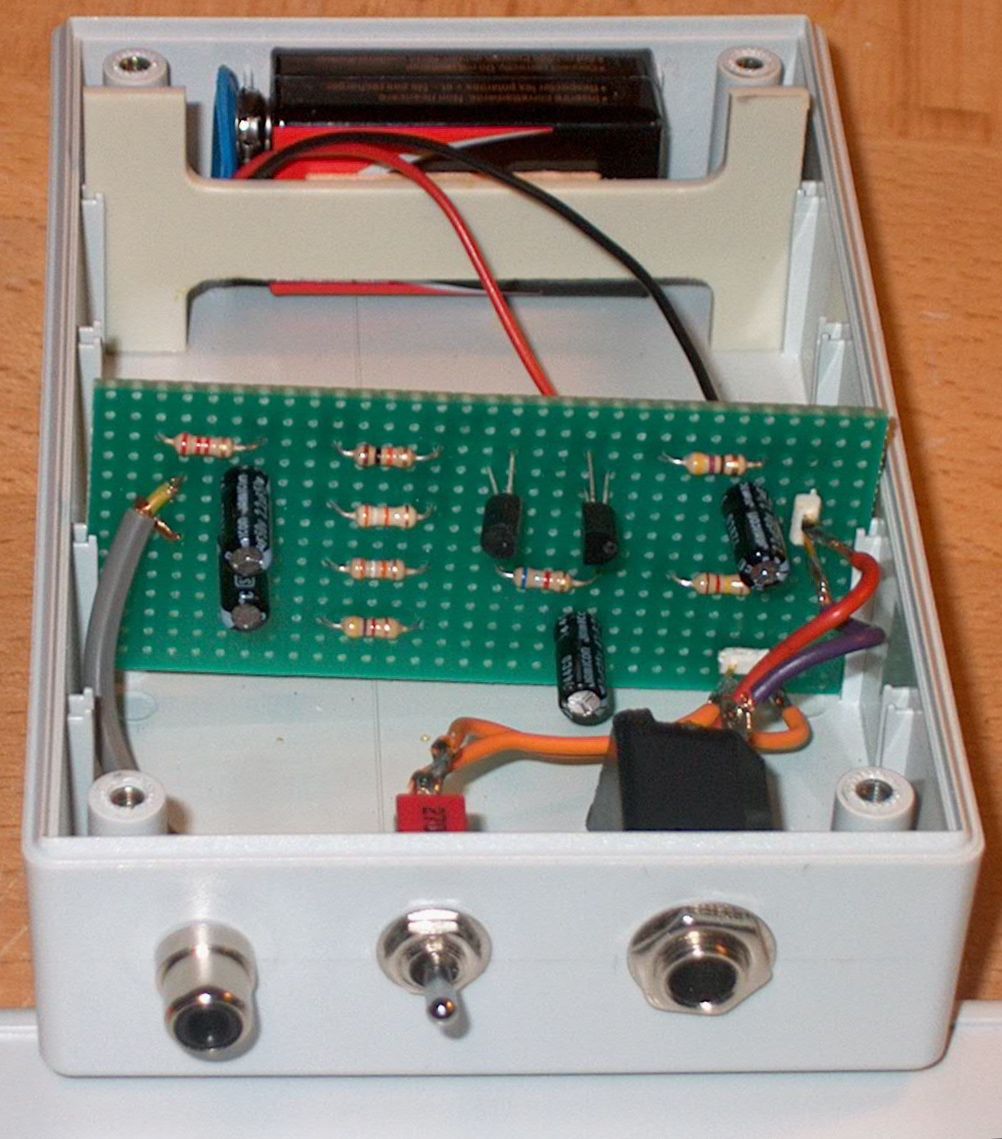
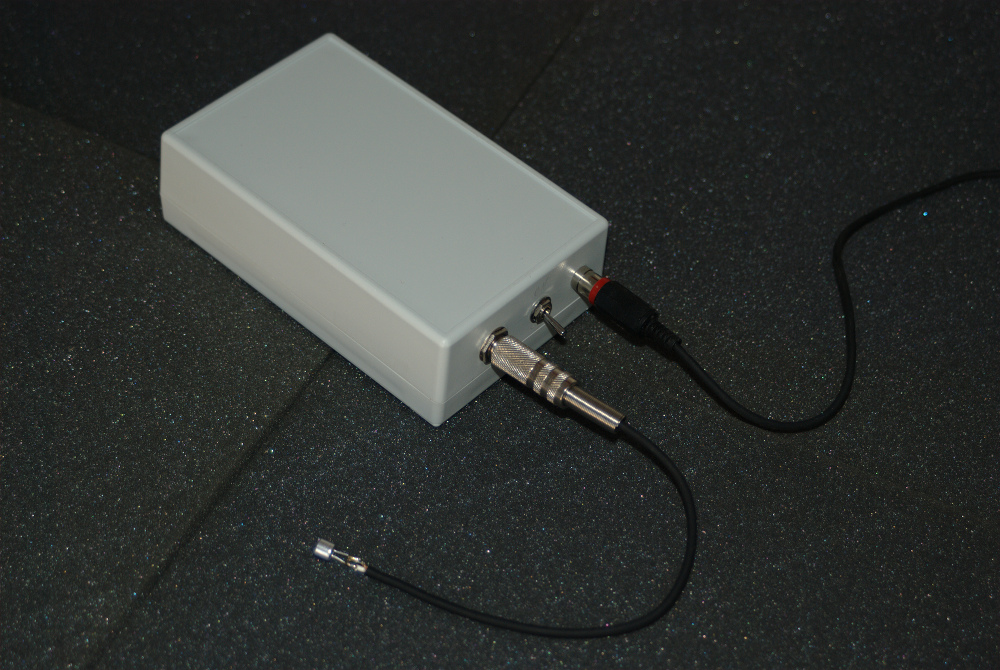 The output of the microphone preamplifier is connected to the external microphone input of the computer.
 - A lightweight hammer
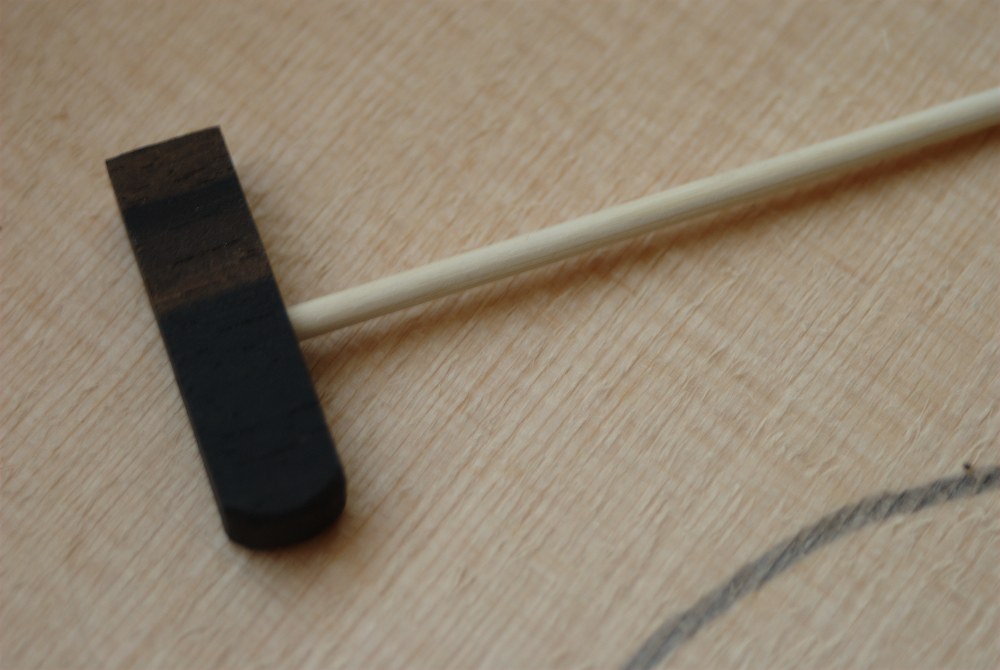 to bring the soundboard material into vibration This one is made from a piece of ebony and weighs 2g. The weight of the little hammer is of importance. If the weight is too high the measurement will not be possible, other unwanted vibration modes will disturb the measurement and mask the peak of the longitudinal resonance.
 - Software
We use an FFT program for frequency analysis. Various suitable freeware or shareware programs are available for download from the Internet. We use the Audacity program that is available for Mac, Windows and Linux.
METHOD
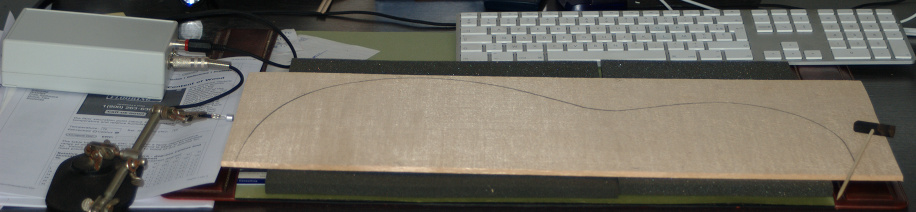
It is the intention to bring the soundboard material into longitudinal resonance. We do this by tapping the edge of the soundboard with the little hammer about 10 to 20 times (1 tap usually does not provide enough data for an FFT analysis). The locations where the board is excited and the microphone is placed should be smoothed. Rough surfaces tend to disturb the measurement.
The microphone to capture the resonance frequencies is placed close to the edge opposite to the site of the impact of the hammer.
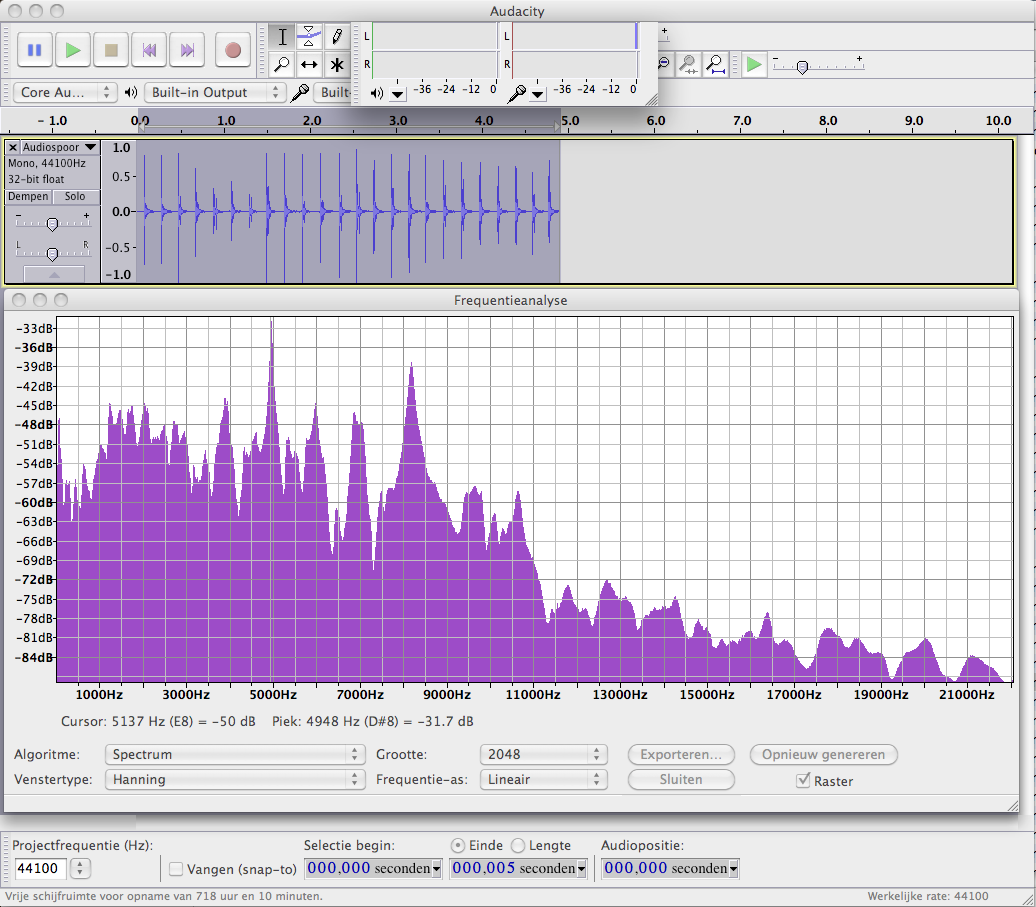
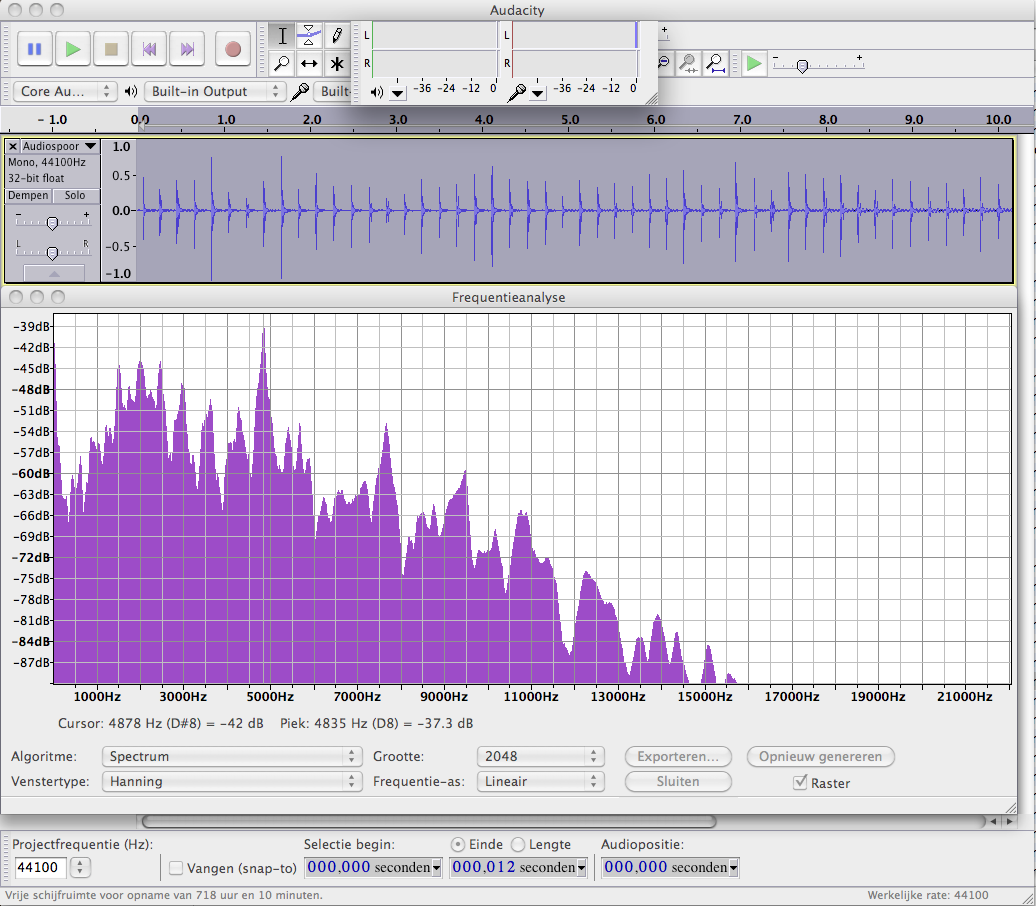
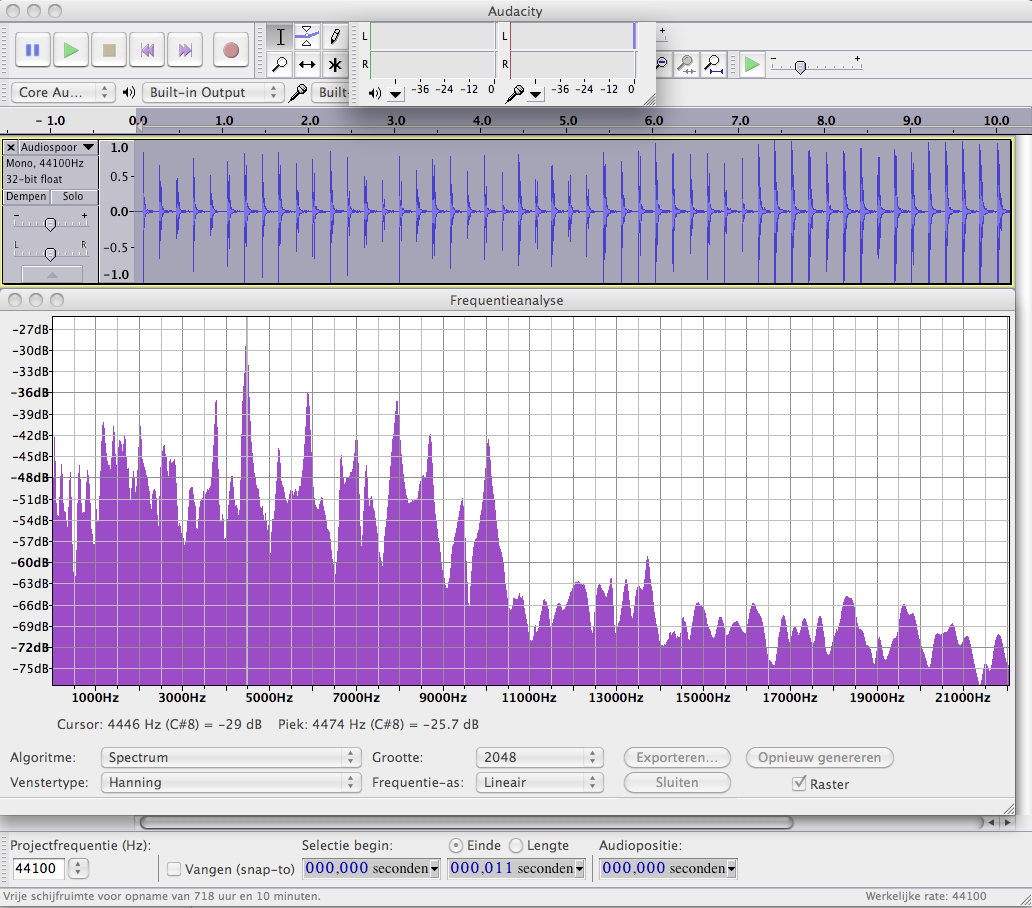
Start the Audacity software. Push the “Record” button, tap rapidly the end that is opposite the microphone, 10 to 30 times. Press the “Stop” button on Audacity. Select the portion of the recording that you wish to analyze. Click “Analyze. Click “Plot Spectrum”. Select “log frequency” on the axis button. Select “2048” on the “size” button. Move the cursor to the highest peak, read the peak frequency and record.
SOUND VELOCITY ALONG THE GRAIN
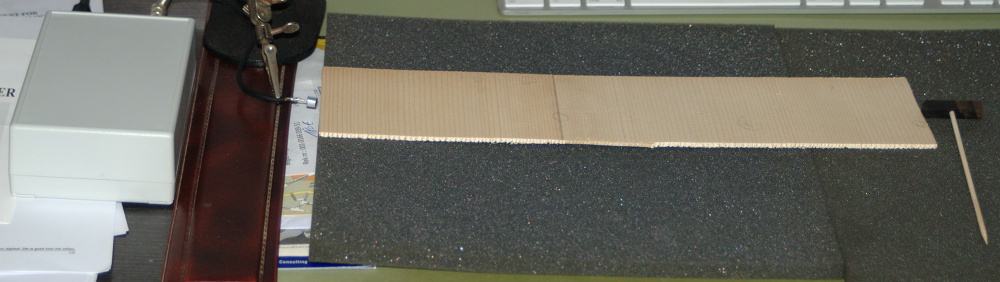
The soundboard blank is best placed on a layer of foam in order to damp some other vibration modes. See picture above.
SITKA
 L=0.58m
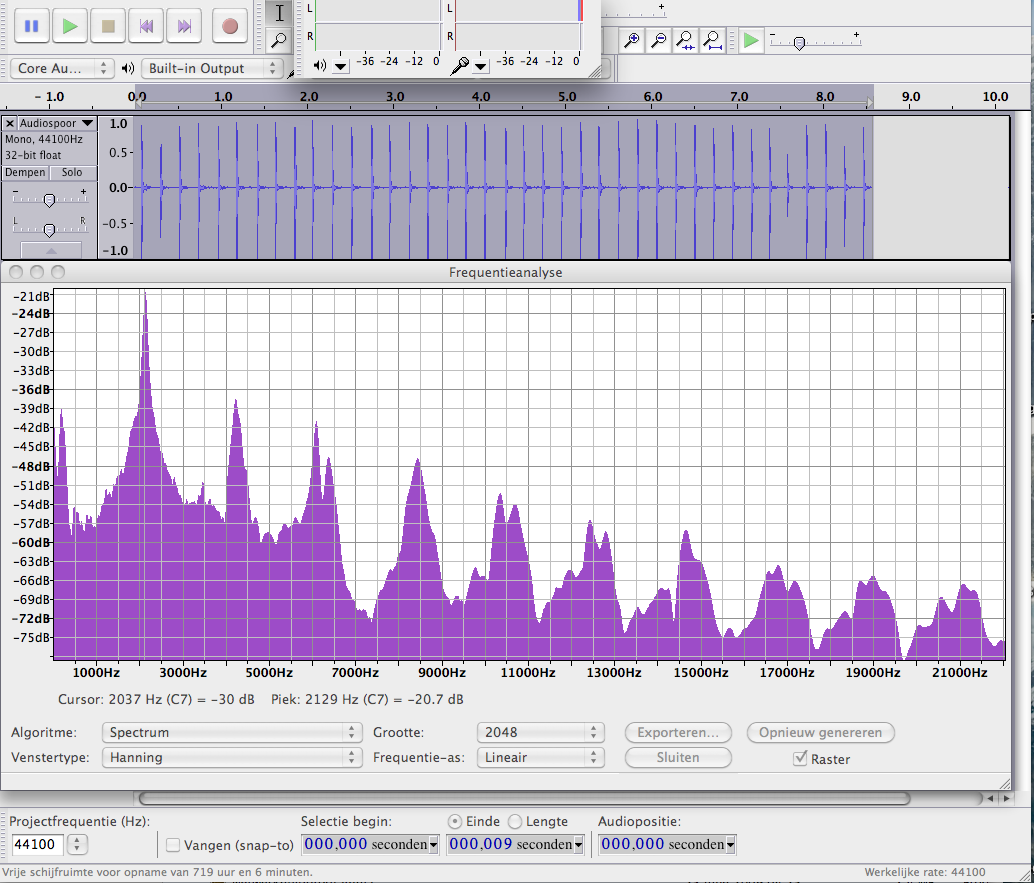
The longitudinal sound velocity of this soundboard material, with highest peak in the FFT graph at 4948 Hz, is calculated as follows:
V = 2 x 0.58 x 4948 = 5740m/s
Density ρ of this sample of Sitka: 375kg/m3
Radiation ratio: V/ρ = 5740/375 = 15.3
ENGELMANN
 L=0.597m
V = 2 x 0.597 x 4835 = 5773m/s
Density ρ of this sample of Engelmann: 395kg/m3
Radiation ratio V/ρ = 5773/395 = 14.6
RED CEDAR
 L=0.591m
V = 2 x 0.591 x 4474 = 5288m/s
Density ρ of this sample of red cedar: 334kg/m3
Radiation ratio V/ρ = 5288/334 = 15.8
All three measurements were performed at a relative humidity of 42%.
All measurement of the sound velocity along the grain were performed without any problem .
SOUND VELOCITY ACCROSS THE GRAIN
It is known that the sound velocity across the grain is about 20% to 30%2 of the sound velocity along the grain.
To make things simple first a pair of measurements were performed on a strip of pine of 8 cm wide. Originally the strip was 42.9 cm long and we obtained the following FFT graph.
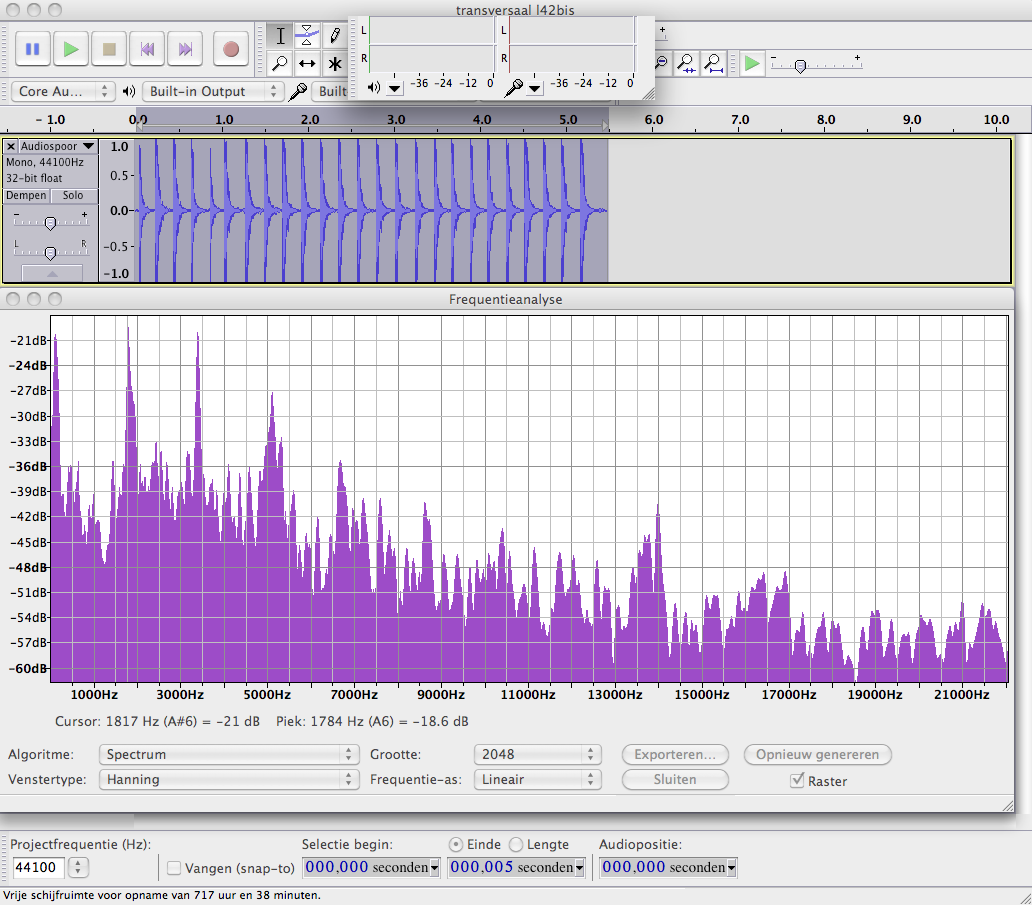 The highest peak is located 1784Hz and when we apply the formula for the sound velocity we obtain:
V = 2 x 0.429 x 1784 = 1530 m/sec
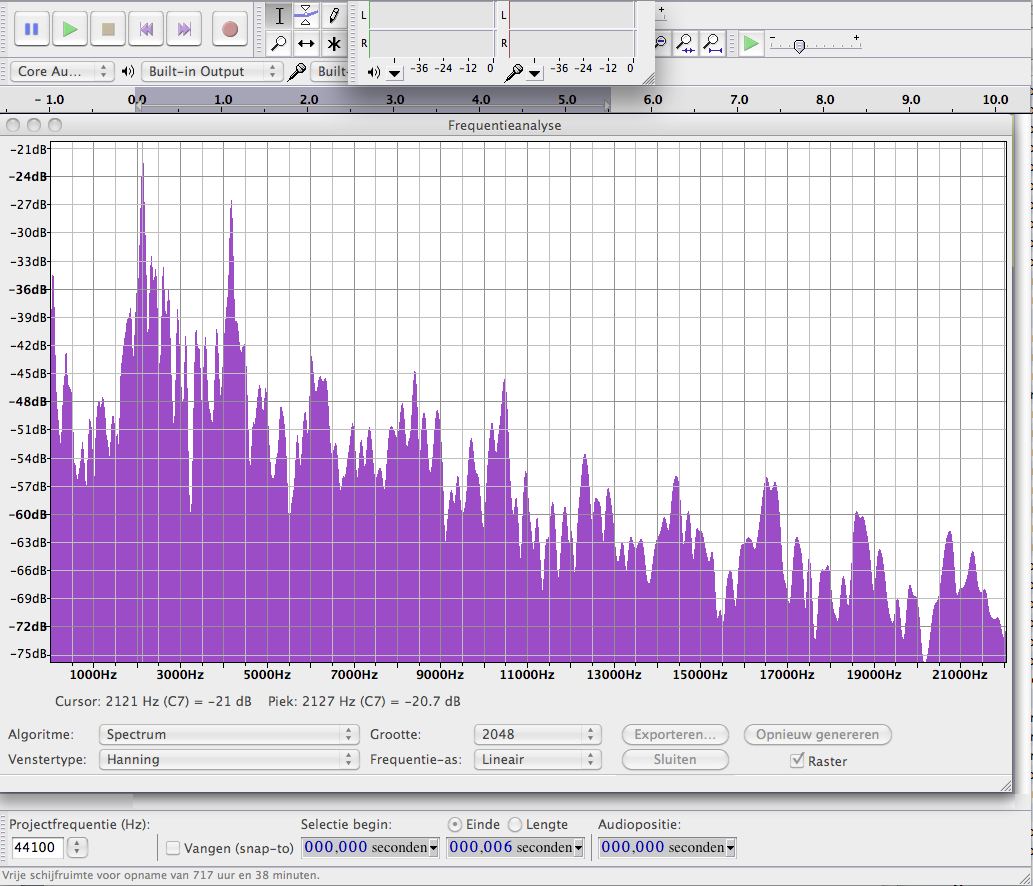 Then the strip of pine was shortened to 35.1 cm.
The corresponding FFT graph is shown here. The highest peak occurs now at 2127 Hz. If we make the calculation again we obtain the following result.
V = 2 x 0.351 x 2127 = 1492 m/sec
This value matches quite well with the value found for the strip of 42.9cm.
Moreover the value found also lies within the window of 1140 to 1710m/sec expected for the sound velocity across the grain.
(The calculation based on the 2nd highest peak of the strip of 42.9 cm returns:
V = 2 x 0.429 x 3392 = 2910
that is far outside of the window for the sound velocity.)
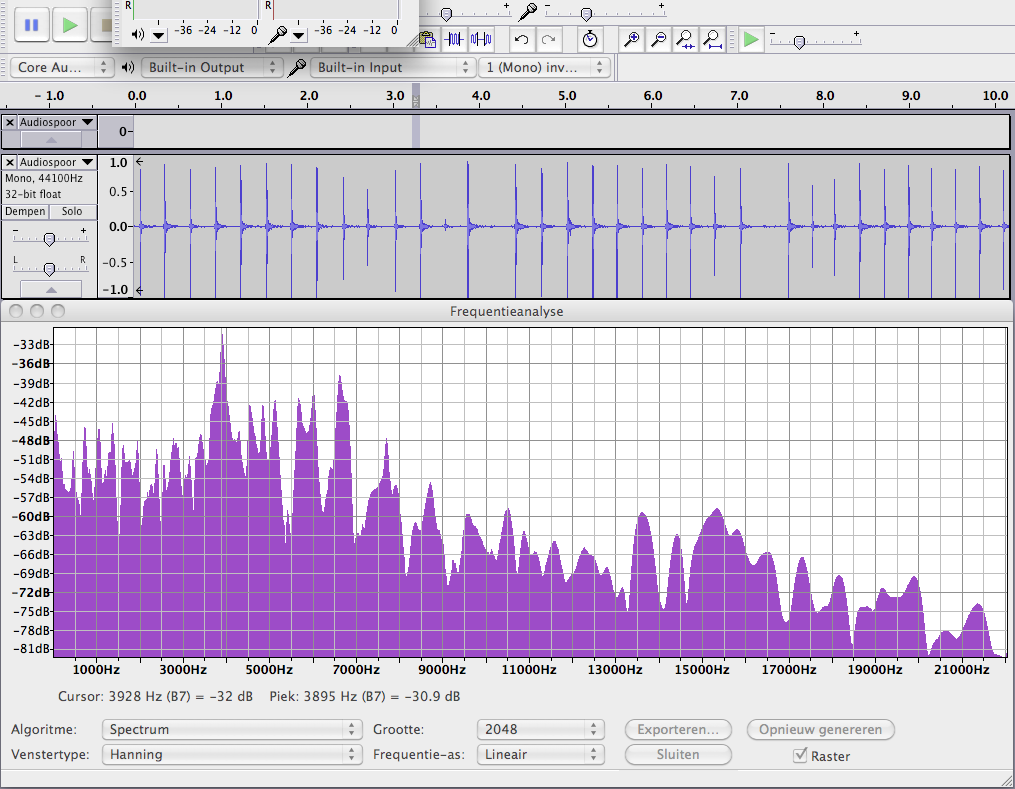
 If we further reduce the width of the strip of pine to 4 cm the overtones become clearly apparent. See FFT diagram.
Although the results should preferably be validated by means of a an other method, we establish that, on the basis of the highest peak, we calculate a value that only depends on the length of the object under test and that lies within the window of values to be expected. In addition, the overtones are a multiple of the fundamental frequency, and can therefore not be the result of the bending mode. One may therefore assume that the value calculated here is indeed the sound velocity across the grain.
We still need to investigate whether this measurement also will succeed on the soundboard wood blanks such as offered on the market for sale.
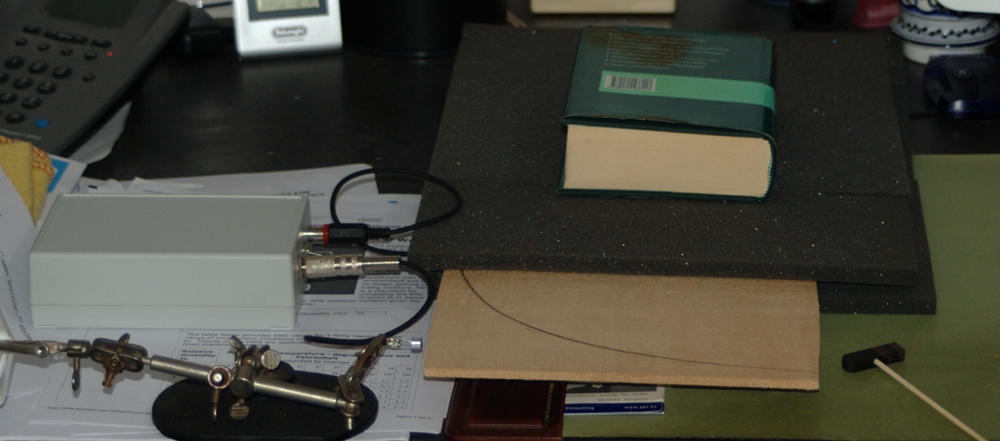 The boards were laid on and covered with foam plastic. A heavy object was placed on top to stabilise the boards and mute the bending mode somewhat. The end where the measurement was performed was left free over a width of about 15 cm. The boards were excited with the little hammer at a few centimetres from the edge of the board transversely to the grain. See picture above
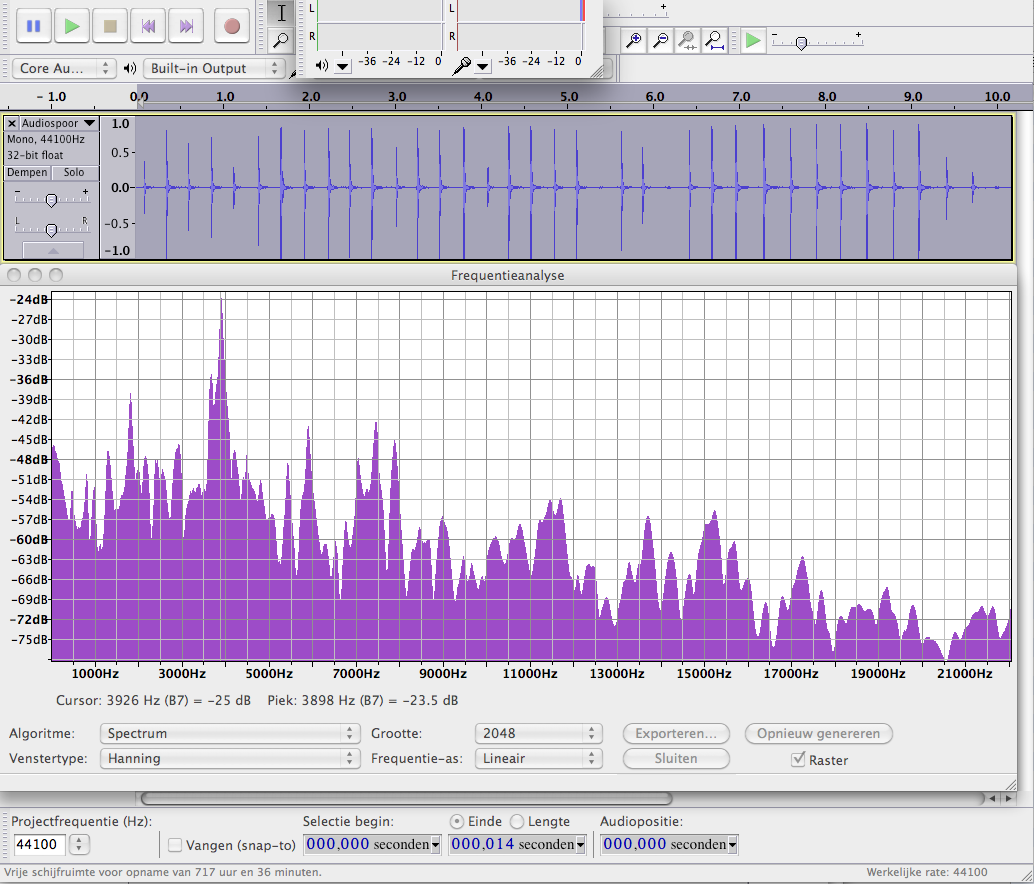
SITKA
![]() A Sitka board of 58 x 20.7 cm.
A Sitka board of 58 x 20.7 cm.
The pattern of the diagram is well reproducible, but as there are plenty of peaks we need to clarify which peak corresponds to the longitudinal resonance. Moreover there are also two high peaks that are close together.
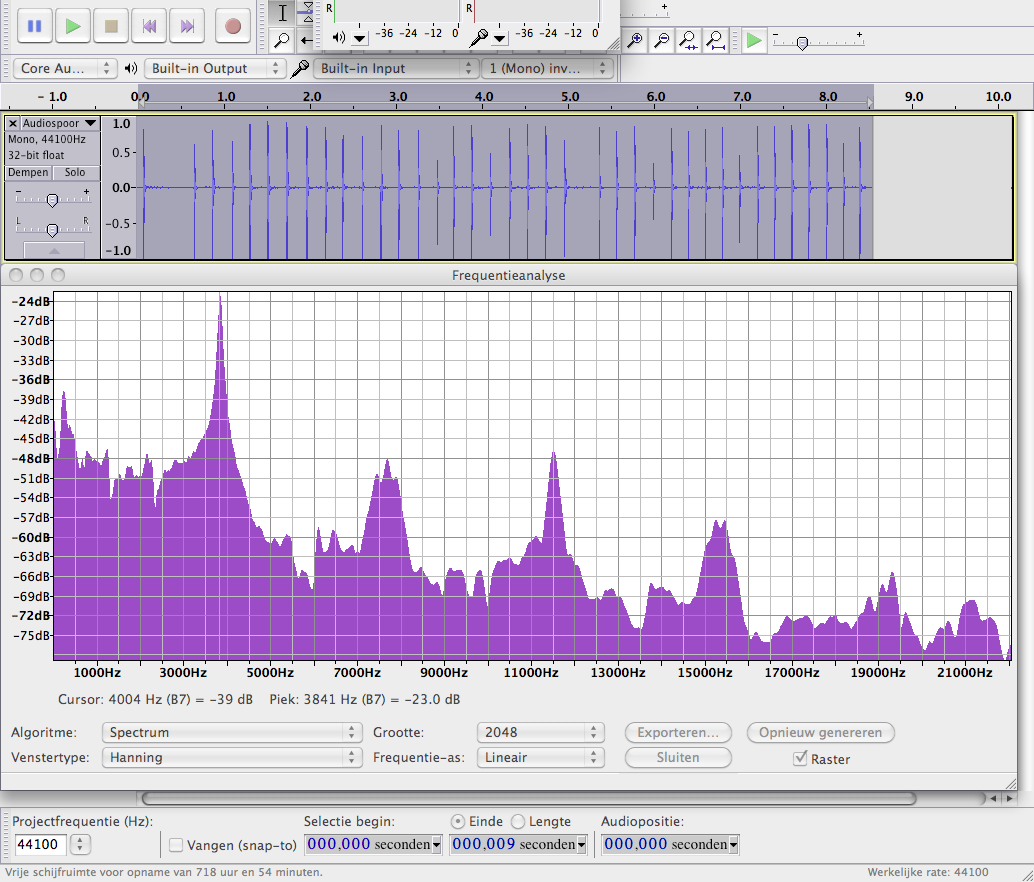
 Therefore a strip of 3cm cut from the board was used to measure again, the length remained unchanged.
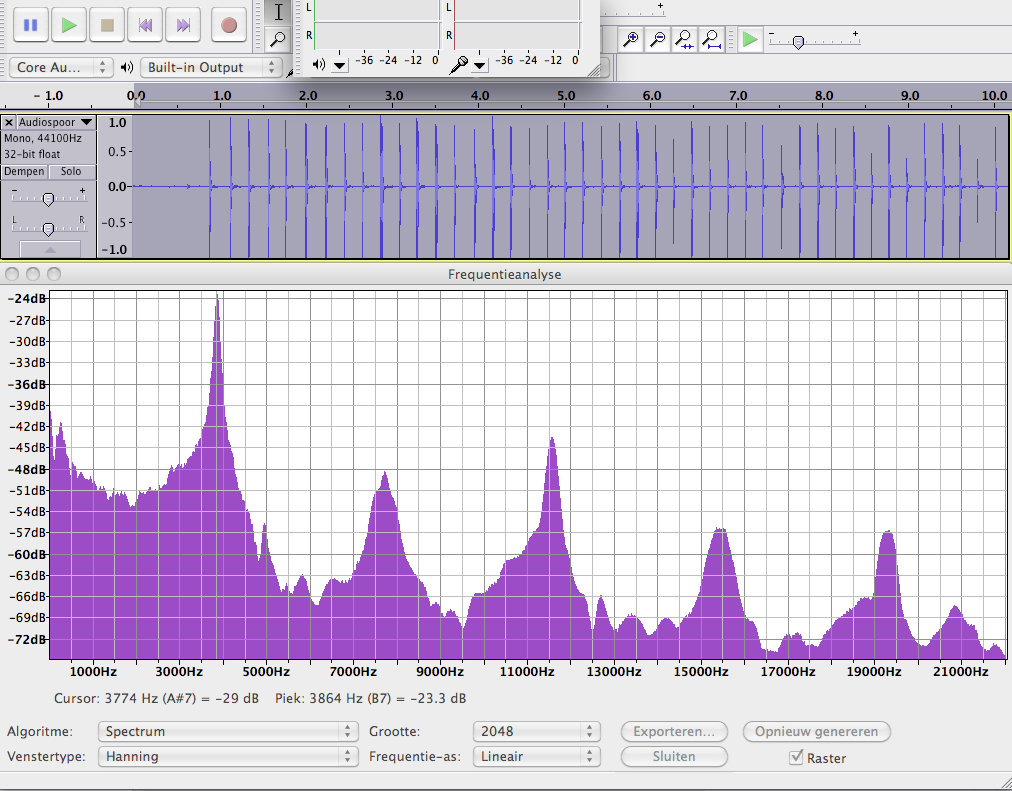
Now it becomes clear that the fundamental frequency of the longitudinal resonance is 3864 Hz and this also correlates with the highest peak, measured on the complete board (3841 Hz).
The sound velocity is now calculated as follows:
V = 2 x 0.207 x 3841 = 1591m/s
Radiation ration = V/ρ = 1591/375 = 4,2
ENGELMANN
 A board of 60cm long and 21.1 cm wide at the place of the measurement.
V = 2 x 0.211 x 3895 = 1644m/s
Radiaton ratio = V/ρ = 1644/395 = 4,2
RED CEDAR
 A board of 59.4 x 22.5cm
V = 2 x 0.225 x 3898 = 1754m/s
Radiaton ration = V/ρ = 1754/334 = 5,3
This value falls just outside the window of 20% to 30% of the expected sound velocity across the grain.
 Therefore a control measurement was performed on a strip of 2.5 cm wide. The length remained the same.
The highest peak is now at 3841 Hz and
V = 2 x 0.225 x 3841 = 1729m/s
This confirms the first measurement
SOUND VELOCITY AND MOISTURE CONTENT OF WOOD.
With increasing moisture content in wood the sound velocity decreases to the point where the timber contains approximately 40% moisture3. Therefore it is important to take the moisture content into account when comparing tone woods.
The Lucchi meter provides a compensation of 1% sound velocity per % moisture content.
The wood used for the previous measurements was already kept a long time in the workshop so we can assume that the moisture content of the wood was in equilibrium with the relative air humidity. In the absence of a wood hygrometer moisture content was not measured. During the measurements the relative humidity of the air varied from 42% to 48%, based on the table on woodbin.com this correspond with an increase in moisture content of about 1%.
CONCLUSION
With the described method and based on the reading of the highest peak in the FFT graph, it is possible to calculate the sound velocity in blanks for guitar tops both along and across the grain.
The calculated values for spruce across the grain also fit very well within the expected window of 20% to 30% of the sound velocity along the grain. The sample of red cedar calculated slightly outside of this window, but the measurement was confirmed by an additional measurement on a narrow strip.
References
- 1. The Lucchi Elasticity Tester, J.E. McLennan, 5 Joanna Close, Charlestown, N.S.W. 2290, Australia,
This email address is being protected from spambots. You need JavaScript enabled to view it. - 2. Wood for sound, Ulrike G., Am. J. Bot. October 1, 2006 93:1369-1378
- 3. Sakai et al. 1990, Butterworth Heinemann Ltd